Real estate and facilities managers around the globe are dealing with unprecedented challenges presented by COVID-19. From immediate work-from-home mandates to the implementation of staggered office hours, organisations are resorting to various tactics in the effort to create social distancing and make their office a low-risk environment.
There has arguably never been a story that has monopolised the media’s attention as much as the current pandemic, and the vast amounts of coverage related to COVID-19 has also led to a wide spectrum of opinions, viewpoints, and even conflicting reports. In confusing times like these, can data help us try to get an objective understanding of the current reality of things?
Looking at data points over the first three months of 2020, we calculated the average weekly peak utilisation in an effort to see how offices around the world are responding to COVID-19 challenges. Here is what we found.
Weekly Peak Office Utilisation in Asia

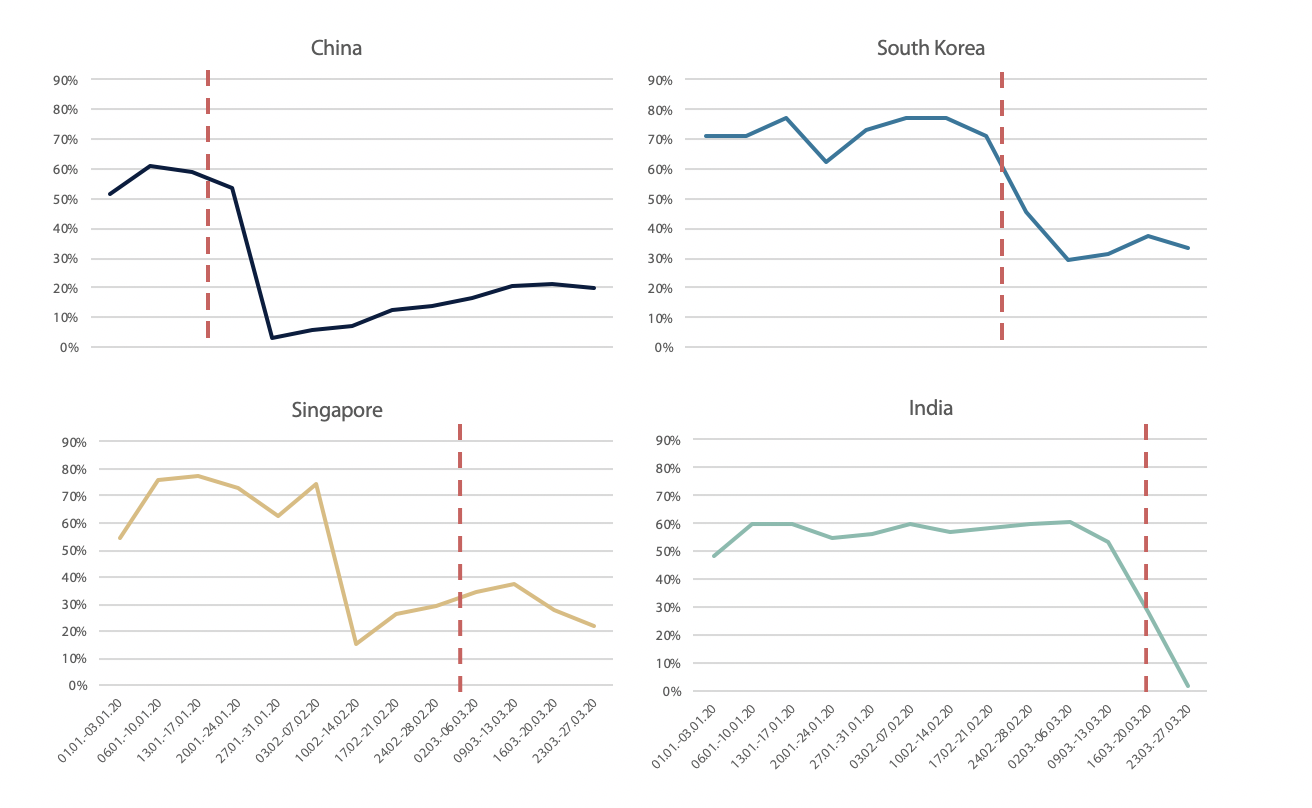
The dashed line denotes when the number of reported COVID cases exceeded 100 in the country
Although in part due to offices shuttering for the Lunar New Year, we can clearly identify when employees stopped coming into the office in China. Since then, the weekly peak utilisation has been steadily increasing, albeit never surpassing 25%.
With corporate buildings never being more than a quarter full, data gathered from Chinese offices are an early indicator of the chilling reality that it may still take several months before employees return to their desks in full force.
Outside of China, Singapore was the quickest country to react to the rapid spread of COVID-19, with office utilisation plummeting to less than 15% in the week of February 10th. In the case of Singapore, we see that office utilisation came all but to a halting stop preemptively: one week before the first Stay-At-Home Notices were issued on February 17th for residents returning from China. Since then, as in China, office utilisation in the city-state has remained for the most part low.
Offices in South Korea began to see a drop in utilisation the week of February 17th, after the 30th confirmed case of COVID-19 in the country. By February 20th, the number of cases jumped to 104, furthering the decline of employees coming into the office. However, what’s curious to note is that even at its lowest point, peak utilisation was around 30%. This is most likely a reflection of the South Korean government’s approach to embrace infection transparency and enable widespread testing rather than completely locking down cities and restricting movement.
Compared to the response of China and Singapore, the reaction from corporate offices in Mumbai and Bangalore was swift but more moderate, spread over the course of two weeks. India reported its 30th confirmed case of COVID-19 on March 4th, and since then, office utilisation has dropped steadily. As the Indian government ordered a nationwide lockdown for 21 days beginning March 25 that includes the closure of commercial and private establishments, utilisation has dropped to almost 0%.
Weekly Peak Office Utilisation in Europe

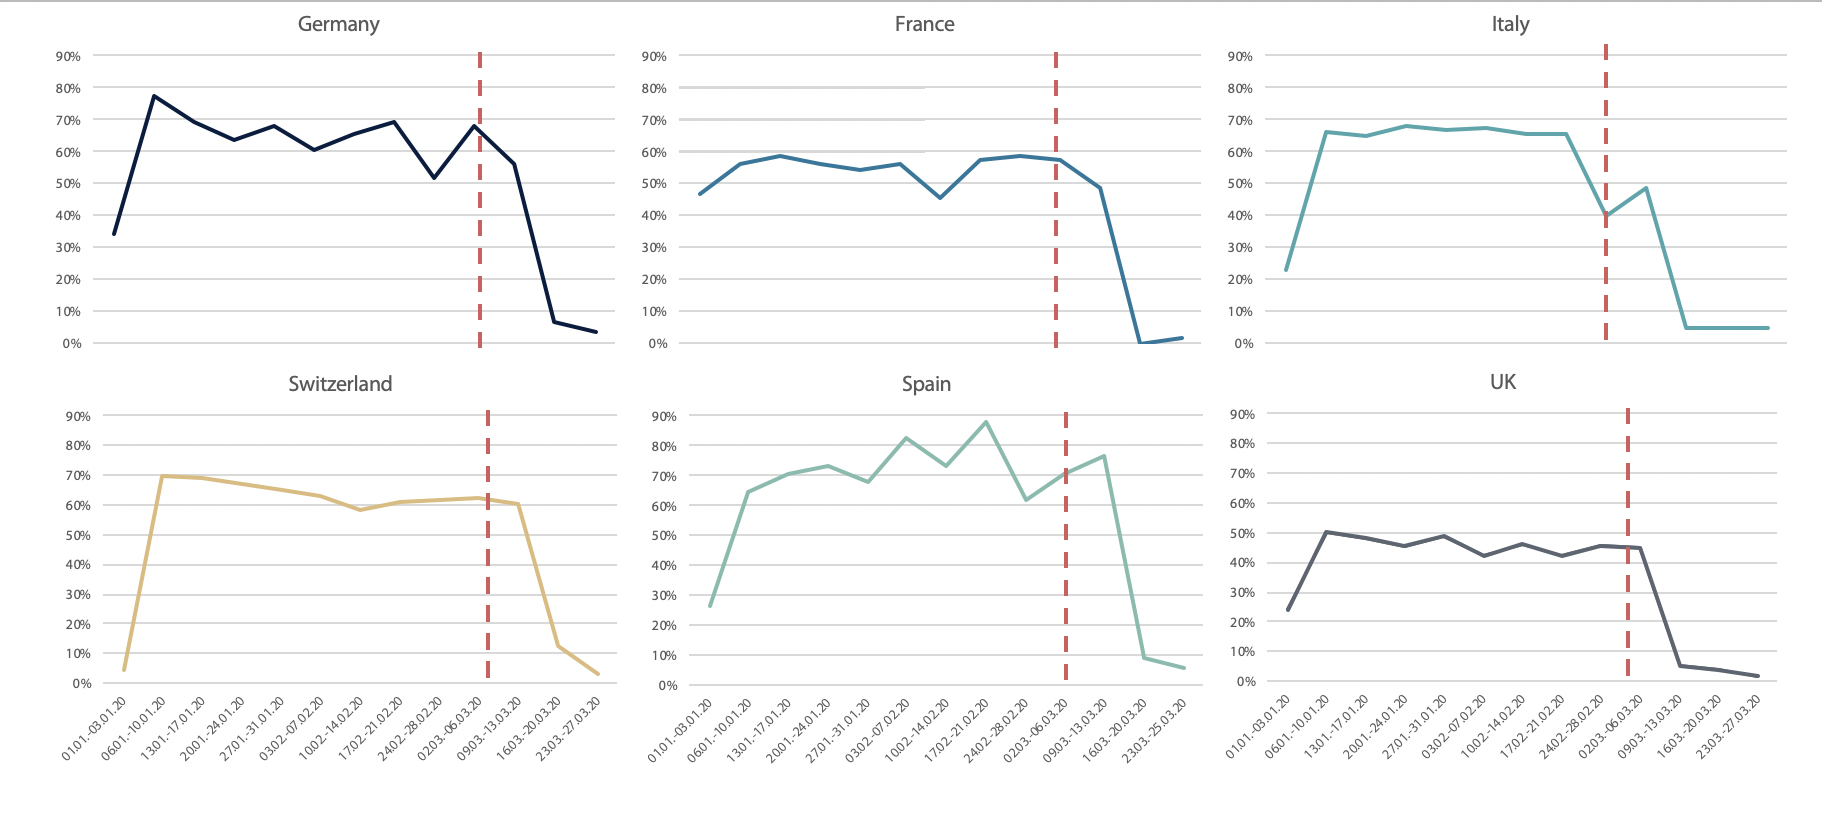
The dashed line denotes when the number of reported COVID cases exceeded 100 in the country
When looking at office use in Europe, all the countries from where data was collected observe a similar pattern: low utilisation at the beginning of the year due to the holiday season, a rough plateau, and then a precipitous drop in the number of employees coming into the office. Compared against offices in China, South Korea, and Singapore, corporate offices in Europe are more or less sitting empty, with peak utilisation under 10% across the board.
It is no surprise that Italy responded the earliest, as the region of Lombardy was Europe’s first hotspot for COVID-19 transmissions. However, initial response from corporations in the UK was also surprisingly swift, ahead of other European countries. This may have been facilitated by key new government measures laid out March 13 which specifies that individuals should work from home if they can.
Even though office utilisation has already been hovering between 0% and 10% for the past three weeks, a look to the data coming from Asian offices can prepare us for at least another month of low office usage. In an optimistic scenario, countries like Spain and Italy who have resorted to the lockdown approach can probably expect offices to reach 25% peak capacity only at the beginning of May. European countries like Sweden which have rejected a lockdown, like South Korea in Asia, can expect their office utilisation to be higher but still experience a reduced overall capacity.
Weekly Peak Office Utilisation in Africa, Americas, and Australia

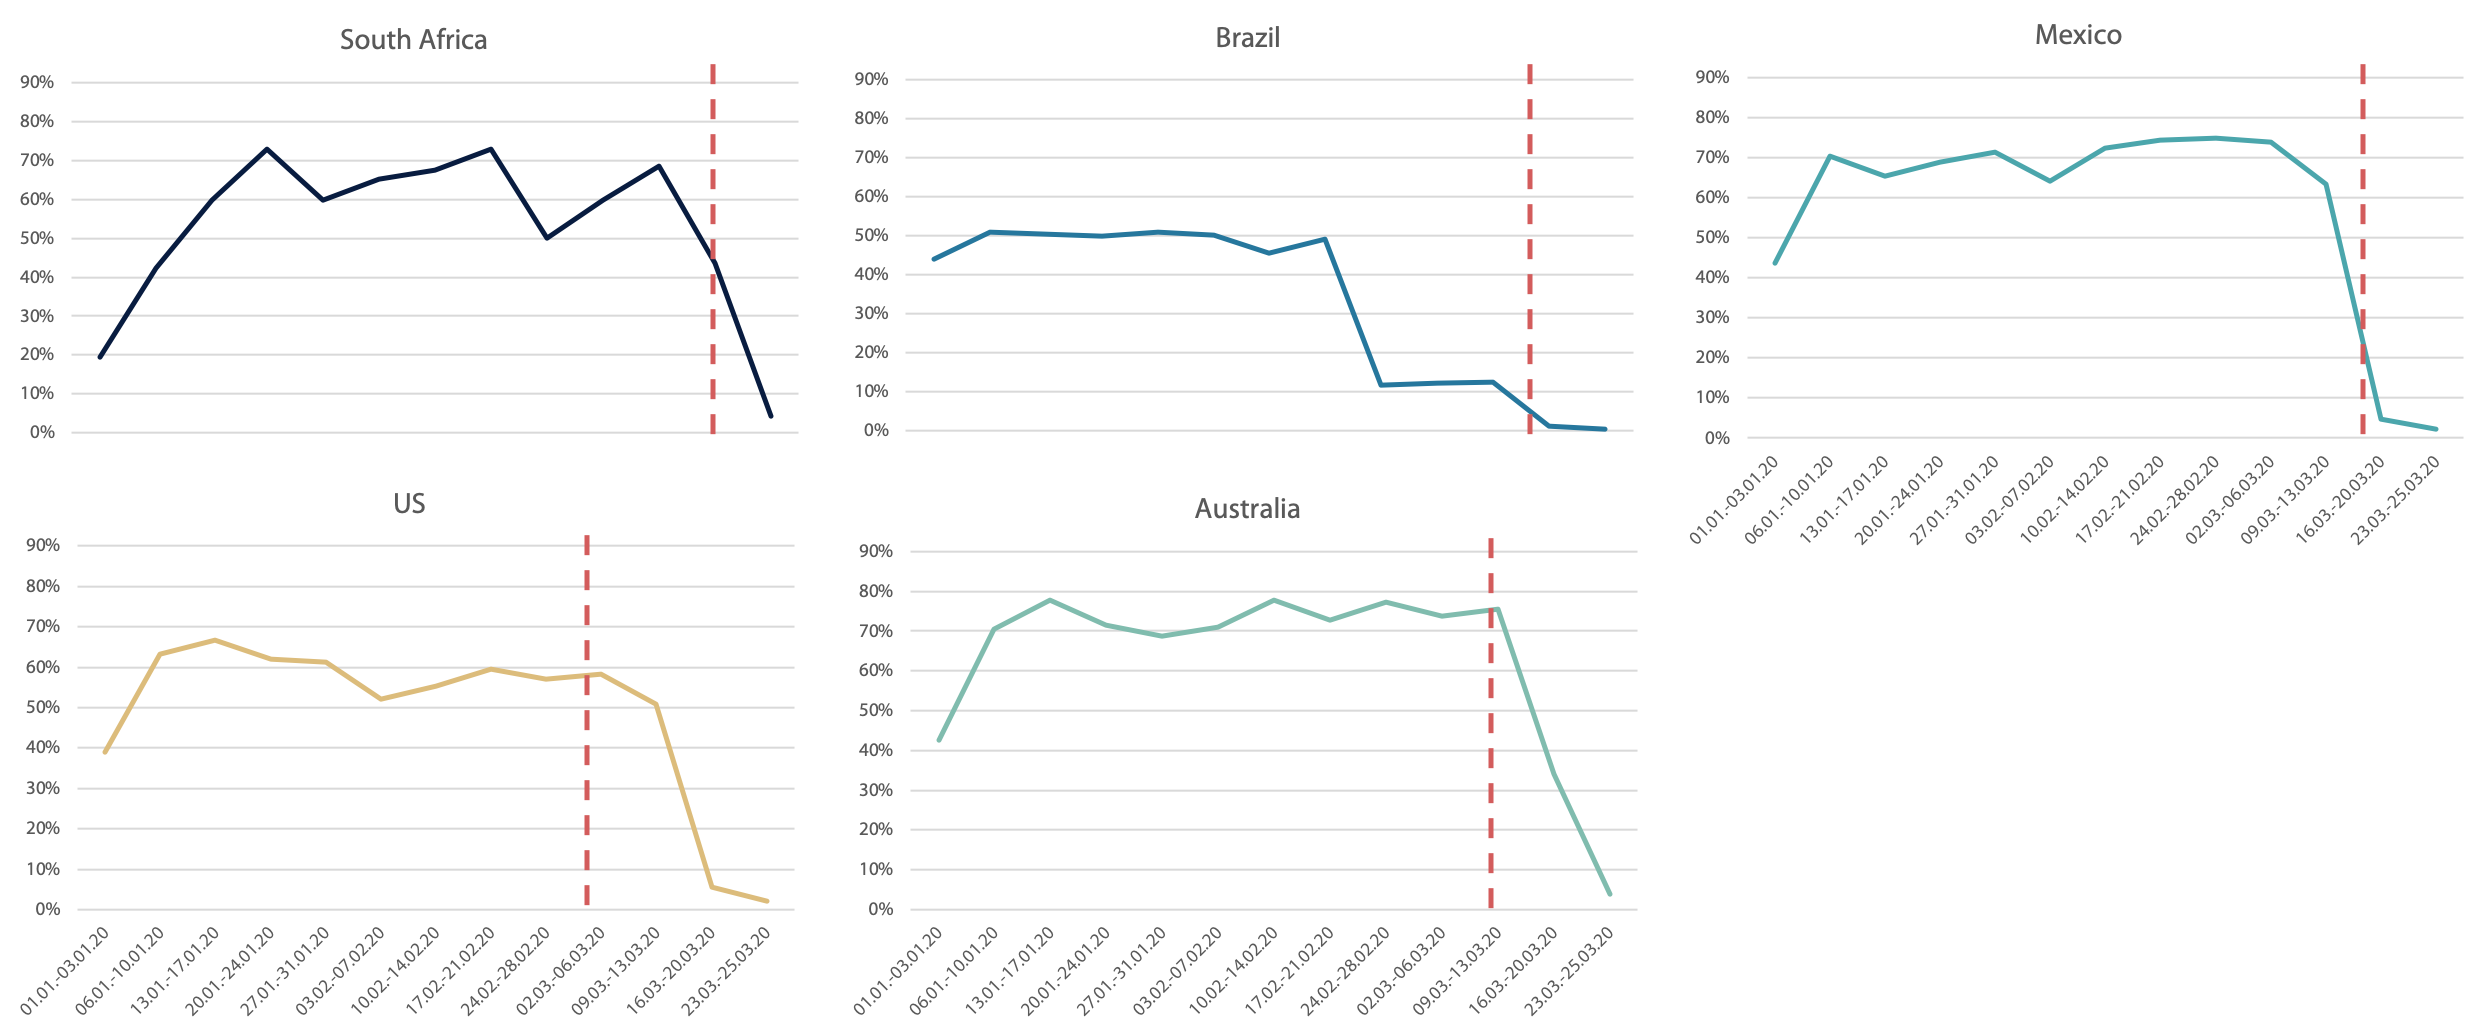
The dashed line denotes when the number of reported COVID cases exceeded 100 in the country
The office utilisation timeline for the rest of the world all follow roughly a similar trend, with the exception of Brazil. The Latin American country was ahead of the curve in emptying out of the office in no small part due to Carnival in Brazil, where an overwhelming majority of employees take several days off to travel. What’s interesting to note is that office utilisation remained low after Carnival even before the first preventative measures were taken by the government in mid-March.
As the last full week of March saw the office utilisation of Brazil, USA, Mexico, Australia, and South Africa all dip below 10% at around the same time, it would be realistic to assume that overall office use will follow a similar pattern in terms of returning to stability: a long, steady climb that extends well into and beyond May.
There are of course many assumptions which have been made in the preceding analyses, and there are as well just as many factors—scientific, political, societal—which will have profound impact on office space utilisation and the rate at which employees return to the office. For real estate managers and facilities managers, the coming months will not only require planning and strategising, it will also test a company’s ability to be agile, nimble, and responsible to the current events.
* Locatee gathered anonymised workplace occupancy data from a sampling of workplaces across 24 cities in 15 countries. Thus, the information and interpretations presented in this article should not be taken as definitive representations of workplace occupancy patterns for entire countries.
For more information about Locatee’s workplace analytics solution, download the Locatee Product Overview.

 10’
10’


