Our mission at Locatee—enabling companies to create places where people love to work—led us to carefully rethink and redesign the look, feel, and functionality of Locatee’s analytics solution. The new Workplace Operations plan has a singular focus: to empower corporate real estate and facilities managers to make better decisions about office spaces at an operational level. Workplace Operations data helps you:
- Master your understanding of your buildings’ utilization
- Prioritize and address space needs and employee requests
- Contribute to your organization’s corporate strategy and growth plans
- Create more effective office spaces and attractive locations to work
Read on to discover all the ways our Workplace Operations update improves portfolio placemaking, or book a demo with a member of the Locateam today.
Granular workplace occupancy data grouped by Floors
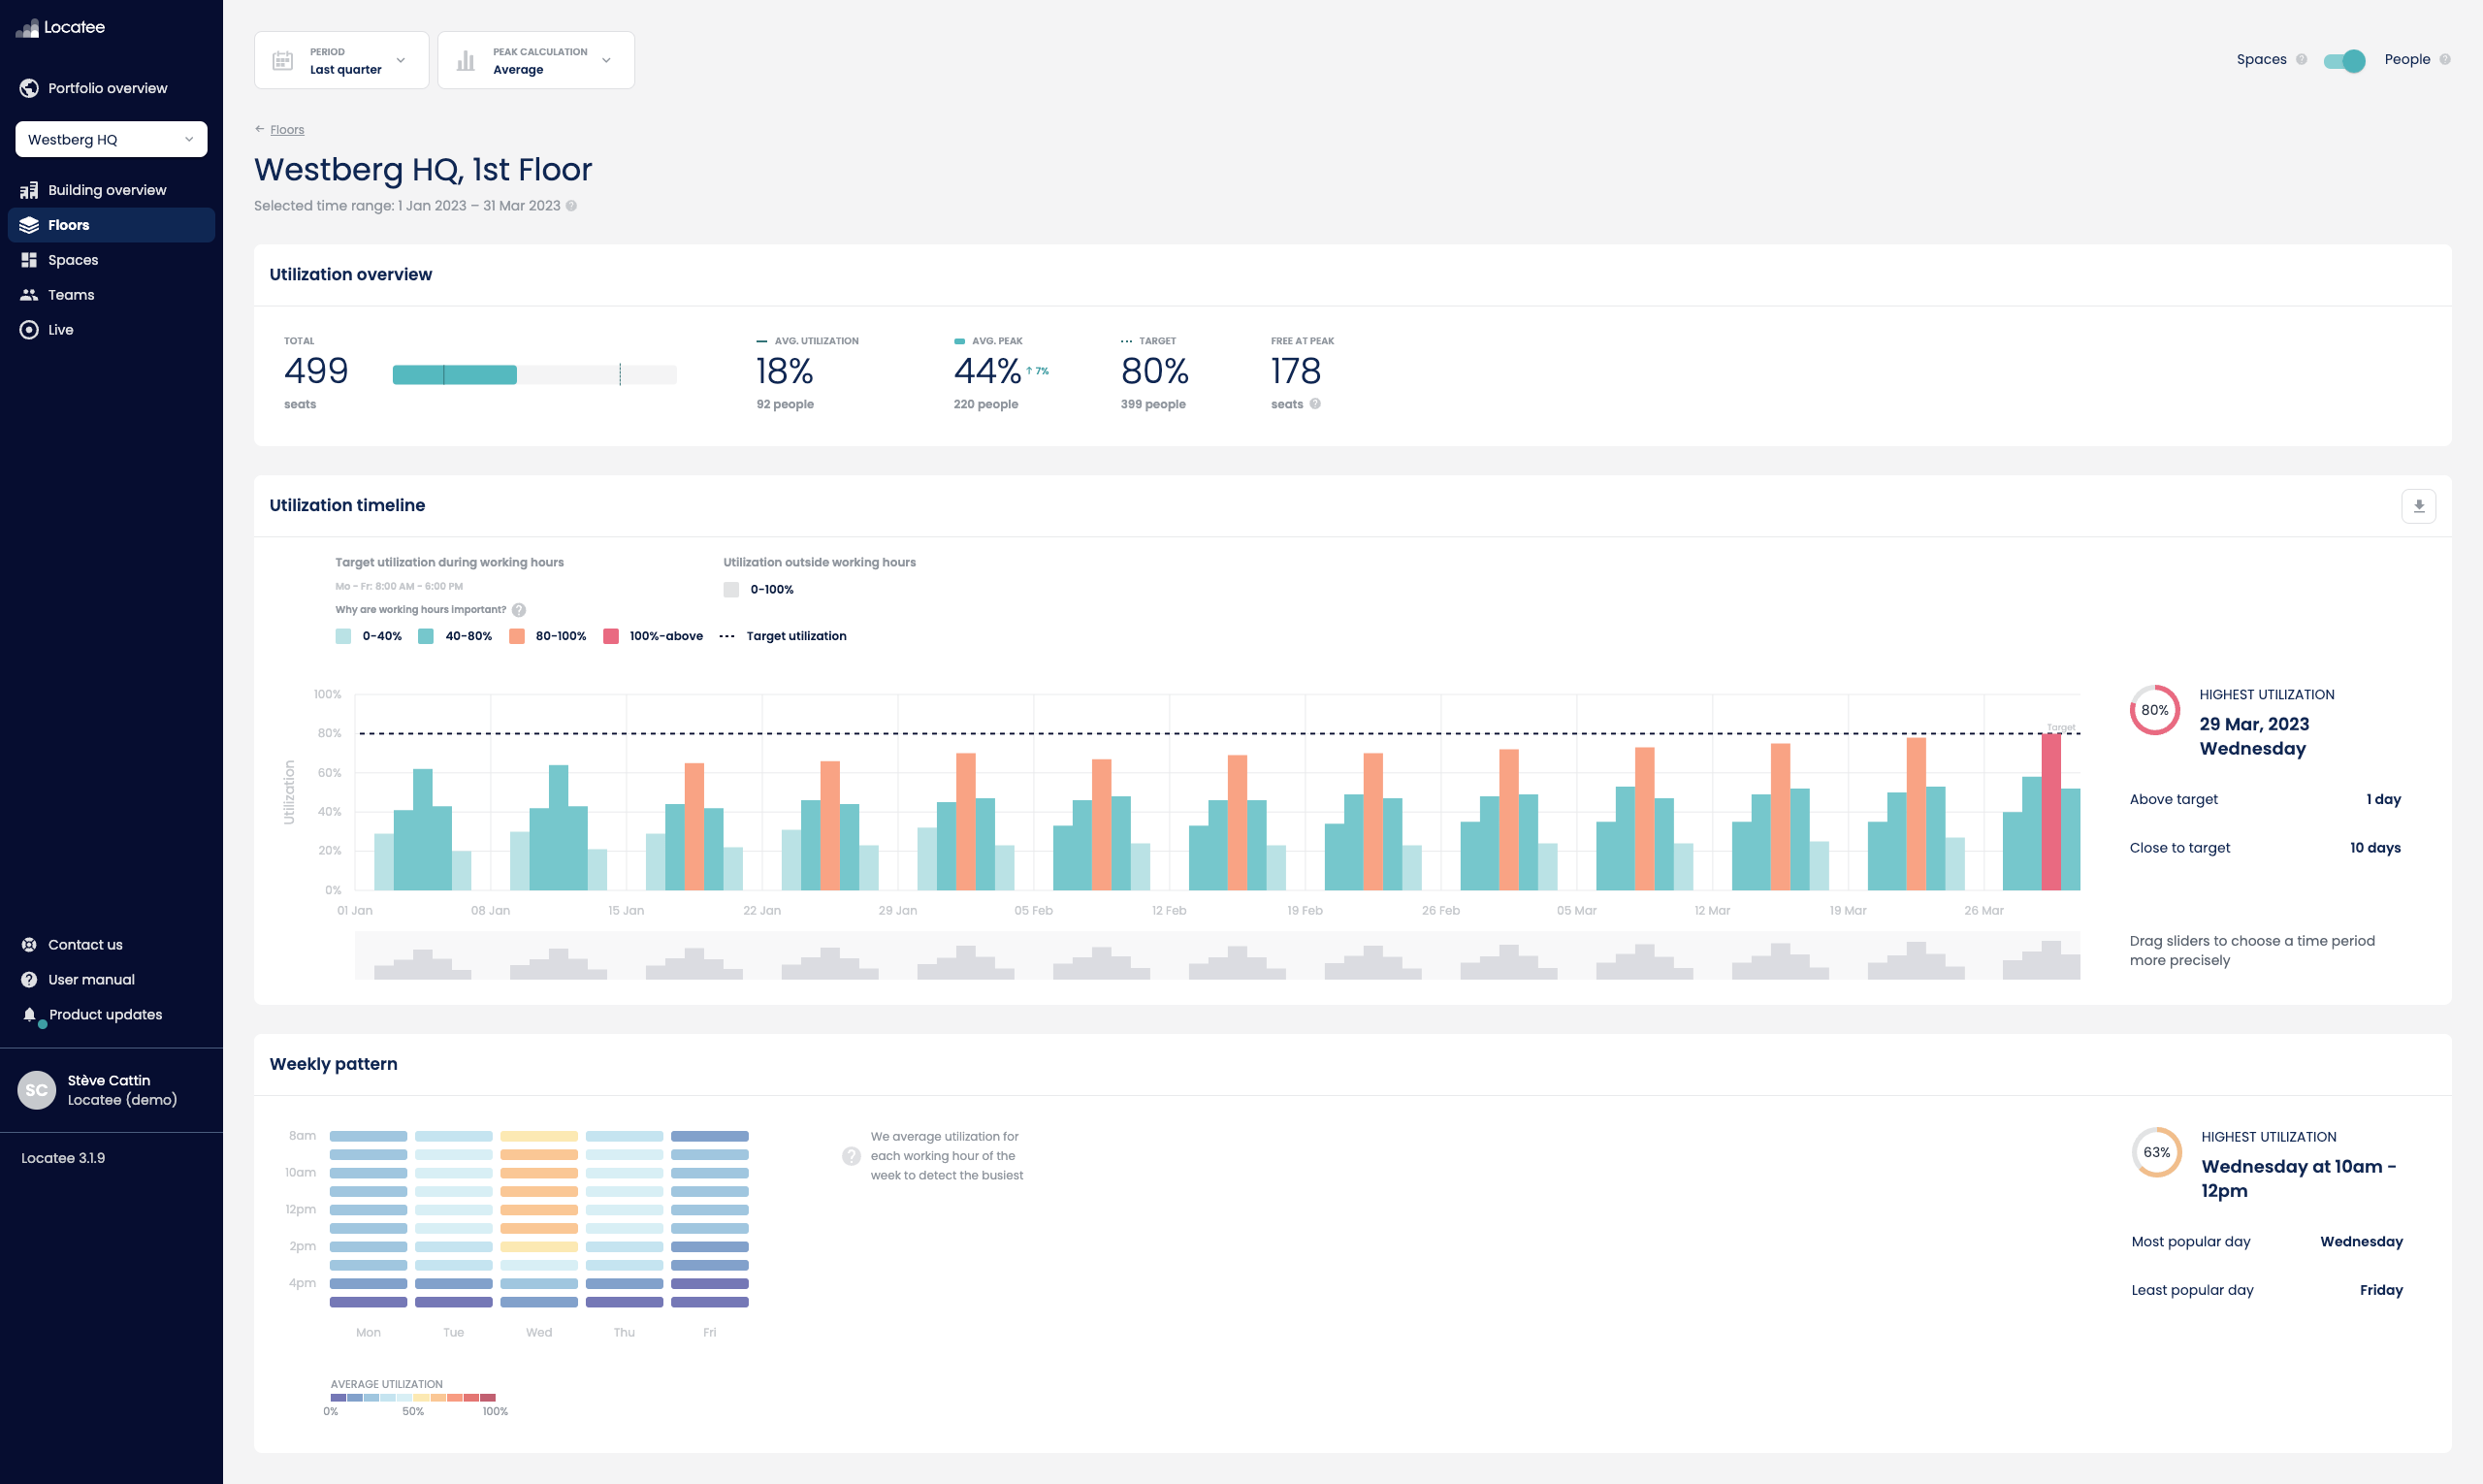
A major improvement in the new Workplace Operations update is the visualization of data by building floor. It’s not only cleaner, but much more intuitive. To start analyzing workplace data by floor, simply select a building from the dropdown menu and click on Floors in the sidebar. You’ll see a summary of your office utilization organized by floor level.
Similar to Locatee’s portfolio-level dashboards, you can segment the data in this view using a variety of filters, allowing you to:
- Understand office density levels by monitoring the absolute peak or average peak occupancy of any floor
- Sort data by utilization metrics for easy identification of optimization opportunities
- Focus on the usage of specific space types with the Space type filter
Tip: For quick and easy stakeholder reporting and presentations, export data directly from the Floors view to Excel.
Detailed views provide a closer look at every floor in your building
Want to investigate utilization on one particular floor? Details will take you to that floor’s dedicated view, which includes its own utilization summary, interactive heat map, and timeline.
- On the top of every detailed floor view is the Utilization overview widget, where you’ll see a summary of vital data points concerning the floor such as:
-
- Average utilization
- Peak utilization
- number of free workspaces available during peak times (Free at peak)
- comparison with average and peak utilizations of the previous period
- A Floor map shows the frequently occupied and frequently neglected spaces on the floor, making it easier to pinpoint problem areas, whether it’s overcrowding or underuse.
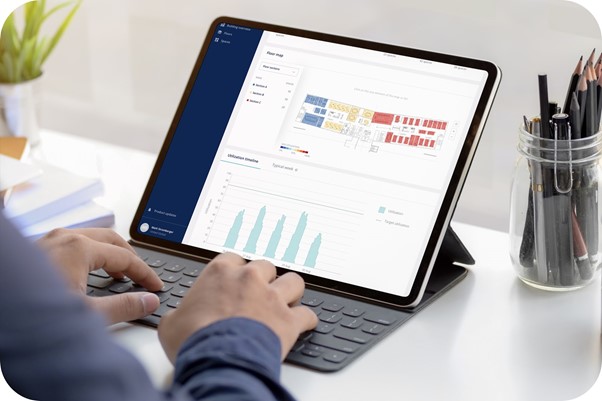
- Also in the Floor map widget is a selector that enables you to zoom in on the utilization of a certain space type (such as desks) or a particular section of a floor (such as the west wing).
- A Timeline is now available for every floor, facilitating the identification of usage patterns and trends on a floor-level basis.
Tip: The new Workplace Operations introduces the option to switch effortlessly between Average Peak and Absolute Peak calculations, making it easier to include or omit data outliers when analyzing office usage and performance.
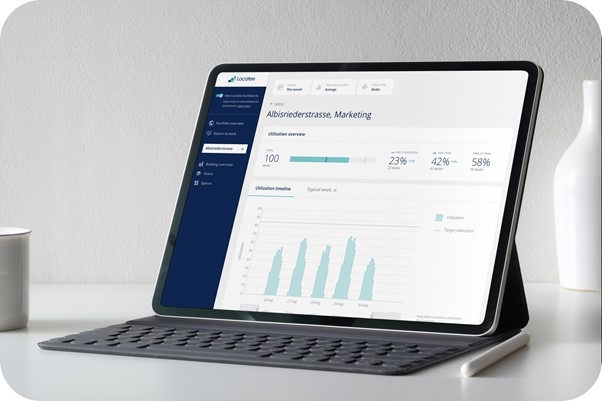
Measure exactly what you need with Spaces
In addition to the Floors view, we’re introducing Spaces. The Spaces view provides a detailed look into a particular segment of your workforce or your physical office space. These segments can be:
- Business units: R&D, IT, marketing, procurement
- Floor sections: meeting areas, Section B, quiet zones, east wing
- Workplace types: desks, meeting rooms, phone booths, standing desks
Spaces give you the flexibility to filter and analyze data using your own custom segmentations, meaning you can measure exactly what you want to measure—nothing more, nothing less.
Dive into the Details for a deeper analysis
Just like Floors, each Space in your building comes with its own detailed view. Here you’ll see a utilization summary, timeline, and floor map of that space.
Tip: You can use Spaces to facilitate workplace decisions such as determining where to place a new department or team. This video shows you how to do just that.
It’s all about 3D: Data, Design, and Decisions
At Locatee, we’re not just in the business of providing you with office occupancy data. We know that there is a lot of information out there already. Our aim is to help you harness all that information, so you can:
- Measure what you really want by creating custom segmentations
- Arrive at decisions with more confidence using historical and live data
- Set the correct expectations and easily update key stakeholders with interactive data and exportable reports
- Create better workplaces for your workforce with the help of the most detailed and granular data
Want to learn more about how to use Locatee Workplace Operations to create better offices? Schedule a demo today!
About the author
Michelle Pijanowski
Marketing and Content CoordinatorA traveller at heart, Michelle has always been excited by storytelling and connecting with people from all walks of life. Her passion for content creation started when she accidentally landed an internship in marketing that ended up leading her into the worlds of social media and journalism. Now equipped with a degree in Communication and Media from the University of Calgary in Canada, she supports the Locatee team as the Junior Marketing Manager.